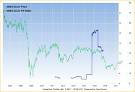
Geodrill Limited
TSX:GEO.TO · Toronto Stock Exchange
-$0.04 today
Vol 0.00M · Avg 0.02M
Balance Sheet
Inspect the capital base behind the business
Review assets, liabilities, equity, cash, and debt to judge whether the company has the financial position to support future returns.
Balance Sheet
Assets, liabilities & equity
| Cash & Equivalents | $12.3M |
| Short-term Investments | $268.4K |
| Receivables | $50.2M |
| Inventory | $38.8M |
| Other Current | $2.0M |
| Total Current Assets | $103.5M |
| PP&E (Net) | $73.8M |
| Tax Assets | $448.7K |
| Other Non-current | $1 |
| Total Non-current Assets | $74.2M |
| Total Assets | $177.7M |
Analysis
Selected assets total $177.7M for Latest. The largest visible component is PP&E (Net) at $73.8M, about 41.5% of the tab total. Use the mix to judge balance sheet concentration, liquidity, leverage, and how much of book value is supported by tangible operating assets.
Balance Sheet
Annual data · 5 periods
| Metric | FY2025 | FY2024 | FY2023 | FY2022 | FY2021 | FY2020 | FY2019 | FY2018 |
|---|---|---|---|---|---|---|---|---|
| Cash & Equivalents | $17.3M +32.3% | $13.1M -16.5% | $15.6M +8.7% | $14.4M +55.2% | $9.3M | $1.0B | $841.8M | $673.8M |
| Short-term Investments | $1.7M -74.2% | $6.5M +3604.8% | $174.6K -75.8% | $720.5K -83.1% | $4.3M | -$1.6B | $445.6M | $378.4M |
| Net Receivables | $44.3M +46.4% | $30.2M -7.4% | $32.7M -4.8% | $34.3M +44.7% | $23.7M | $533.8M | $399.4M | -$1.7B |
| Inventory | $36.5M -0.6% | $36.7M +4.2% | $35.2M +11.5% | $31.6M +13.4% | $27.8M | $641.6M | $328.0M | $316.8M |
| Other Current Assets | $5 | $0 | $0 | $0 -100.0% | $6.8M | $1.5B | $966.4M | $764.8M |
| Total Current Assets | $101.8M +14.6% | $88.8M +4.8% | $84.8M +2.3% | $82.9M +24.3% | $66.7M | $12.5B | $10.5B | $5.5B |
| Property, Plant & Equipment (Net) | $74.5M +2.5% | $72.7M +15.4% | $63.0M +7.9% | $58.4M +17.0% | $49.9M | $1.2B | $1.5B | $687.8M |
| Goodwill | $0 | $0 | $0 | $0 | $0 | $925.8M | $466.6M | $309.8M |
| Intangible Assets | $0 | $0 | $0 | $0 | $0 | $568.8M | $860.0M | $1.5B |
| Long-term Investments | $0 | $0 | $0 | $0 | $0 | $524.0M | -$1.5B | $860.0M |
| Tax Assets | $0 | $0 -100.0% | $877.8K | $0 | $0 | $1.5B | $1.4B | $1.4B |
| Other Non-current Assets | $0 | $0 | $0 +100.0% | -$58.4M -17.0% | -$49.9M | $1.4B | $1.0B | $679.4M |
| Total Non-current Assets | $74.5M +2.5% | $72.7M +13.8% | $63.8M +9.4% | $58.4M +17.0% | $49.9M | -$15.3B | $14.8B | $11.3B |
| Total Assets | $176.3M +9.2% | $161.5M +8.7% | $148.6M +5.2% | $141.2M +21.2% | $116.6M | $13.3B | $11.9B | $10.6B |
| Account Payables | $15.2M +28.8% | $11.8M +1.0% | $11.7M +23.8% | $9.4M +33.3% | $7.1M | $1.3B | -$1.5B | $1.4B |
| Short-term Debt | $0 | $0 | $0 | $0 | $0 | -$1.6B | -$1.6B | $326.6M |
| Tax Payables | $0 -100.0% | $5.4M +145.9% | $2.2M -61.5% | $5.8M +158.2% | $2.2M | $574.4M | -$1.5B | $1.4B |
| Deferred Revenue | $0 | $0 | $0 | $0 | $0 | -$1.6B | $374.2M | $542.2M |
| Other Current Liabilities | $26.4M +233.9% | $7.9M -32.1% | $11.6M +343.3% | $2.6M -33.7% | $4.0M | $1.1B | $1.5B | $493.2M |
| Total Current Liabilities | $55.6M +48.7% | $37.4M +5.0% | $35.6M +25.7% | $28.3M +27.0% | $22.3M | $6.0B | $10.1B | $14.3B |
| Long-term Debt | $1.3M -43.2% | $2.3M +599.0% | $333.3K | $0 | $0 | $1.3B | $438.6M | $1.3B |
| Deferred Tax Liabilities | $2.0M +7.1% | $1.8M -26.4% | $2.5M -23.6% | $3.3M -3.4% | $3.4M | $746.6M | $612.2M | $477.8M |
| Deferred Revenue (Non-current) | $0 | $0 | $0 -100.0% | $2.0M -32.7% | $2.9M | -$1.6B | $715.8M | $1.3B |
| Other Non-current Liabilities | $0 | $0 | $0 | $0 | $0 | $489.0M | $1.1B | -$1.5B |
| Total Non-current Liabilities | $3.5M -23.9% | $4.6M +50.7% | $3.0M -48.0% | $5.8M -13.2% | $6.7M | $3.9B | $7.5B | $14.1B |
| Total Liabilities | $59.1M +40.8% | $42.0M +8.6% | $38.6M +13.1% | $34.2M +17.7% | $29.0M | $14.7B | $3.7B | $9.6B |
| Common Stock | $28.4M -0.5% | $28.5M +1.0% | $28.3M +0.5% | $28.1M +13.1% | $24.9M | $651.4M | $517.0M | $382.6M |
| Retained Earnings | $85.6M -2.0% | $87.4M +11.9% | $78.1M +3.4% | $75.6M +28.5% | $58.8M | -$1.6B | $519.8M | $1.1B |
| Accumulated OCI | $3.9M -1.8% | $3.9M +5.6% | $3.7M +10.6% | $3.4M -12.4% | $3.9M | $393.8M | $550.6M | $707.4M |
| Other Stockholders Equity | $0 | $0 +100.0% | -$2 | $0 +100.0% | -$2 | $351.8M | -$1.6B | $1.5B |
| Minority Interest | -$692.9K -98.2% | -$349.5K -126.2% | -$154.5K -789.4% | -$17.4K +11.4% | -$19.6K | $1.4B | $337.8M | $931.4M |
| Total Equity | $117.2M -1.9% | $119.5M +8.7% | $110.0M +2.7% | $107.1M +22.3% | $87.5M | $9.1B | $7.7B | $3.3B |
| Total Debt | $10.3M +197.5% | $3.4M +252.6% | $978.3K -83.2% | $5.8M -23.5% | $7.6M | $724.2M | $410.6M | $399.4M |
| Net Debt | -$7.0M +27.1% | -$9.6M +34.5% | -$14.7M -71.0% | -$8.6M -414.8% | -$1.7M | $389.6M | $501.6M | $311.2M |
Older periods hidden.
Sign in to unlockCompetitors
Peer companies in the same sector
Doubleview Gold Corp.
DBG.V
$610.36M

Foraco International S.A.
TSX:FAR.TO
$270.83M
Global Atomic Corporation
TSX:GLO.TO
$225.67M

Laramide Resources Ltd.
TSX:LAM.TO
$198.73M
Greenland Resources Inc.
MOLY.NE
$190.47M
Graphite One Inc.
GPH.V
$174.24M
Cornish Metals Inc.
CUSN.V
$169.36M
Nicola Mining Inc.
NIM.V
$138.16M
Frontier Lithium Inc.
FL.V
$127.79M
CanAlaska Uranium Ltd.
CVV.V
$110.06M
SEC Filings
Recent regulatory filings
No filings found.
How much cash does GEO.TO have?
Geodrill Limited (GEO.TO) reported $17.26M in cash and equivalents in fiscal 2025.
How much debt does GEO.TO carry?
Geodrill Limited (GEO.TO) reported $10.26M of total debt, with net debt of -$7,000,309.00.
Explore More
Continue the stock analysis
Jump to another research area for this company.