Generation Mining Limited
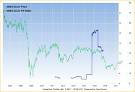
TSX:GENM.TO · Toronto Stock Exchange
-$0.04 today
Vol 0.68M · Avg 0.57M
Cash Flow
Check whether earnings turn into cash
Use operating cash flow, capital spending, free cash flow, and financing activity to see how much value is left for reinvestment or owners.
Free Cash Flow
Net Income to FCF bridge
Analysis
Analysis will appear once cash flow data is available for this period.
Cash Flow Statement
Annual data · 5 periods
| Metric | FY2025 | FY2024 | FY2023 | FY2022 | FY2021 | FY2020 | FY2019 | FY2018 |
|---|---|---|---|---|---|---|---|---|
| Net Income | -$33.9M -56.6% | -$21.6M -21.7% | -$17.8M +68.4% | -$56.2M -229.2% | -$17.1M | $487.6M | $476.4M | $465.2M |
| Depreciation & Amortization | $185.7K -51.0% | $378.7K -74.8% | $1.5M -12.0% | $1.7M +1651.1% | $97.3K | $374.2M | $1.2B | $631.8M |
| Deferred Income Tax | $0 | $0 | $0 +100.0% | -$4.4M | $0 | $1.4B | -$1.5B | $304.2M |
| Stock-Based Compensation | $2.0M +61.6% | $1.2M +13.5% | $1.1M -14.0% | $1.3M -44.7% | $2.3M | $489.0M | $354.6M | -$1.6B |
| Change in Working Capital | $703.3K +194.5% | -$744.1K +46.6% | -$1.4M -187.2% | $1.6M +332.0% | $370.3K | $350.4M | -$1.6B | $1.5B |
| Accounts Receivables | -$67.6K +48.0% | -$130.0K -108.1% | $1.6M +260.1% | -$1.0M -310.0% | -$244.9K | $592.6M | $1.3B | $626.2M |
| Inventory | $0 | $0 | $0 | $0 | $0 | $1.0B | $1.2B | $1.1B |
| Accounts Payables | $0 | $0 | $0 | $0 | $0 | $948.2M | -$1.5B | $433.0M |
| Other Working Capital | $770.9K +225.5% | -$614.1K +79.5% | -$3.0M -215.3% | $2.6M +323.3% | $615.2K | $567.4M | $1.3B | $601.0M |
| Other Non-Cash Items | $24.5M +131.8% | $10.6M +1972.0% | $510.5K -98.0% | $25.3M +13626.5% | -$186.8K | $1.4B | -$1.5B | $300.0M |
| Operating Cash Flow | -$6.5M +36.4% | -$10.2M +36.6% | -$16.1M +47.9% | -$30.8M -112.2% | -$14.5M | $7.2B | $8.9B | $10.5B |
| Capital Expenditures | $0 +100.0% | -$23.5K +96.8% | -$746.2K +47.5% | -$1.4M | $0 | $664.0M | $1.4B | $697.6M |
| Acquisitions (Net) | $0 | $0 | $0 | $0 | $0 | $937.0M | $1.1B | $1.3B |
| Purchases of Investments | $0 | $0 | $0 | $0 | $0 | $444.2M | $1.4B | $1.3B |
| Sales of Investments | $0 | $0 | $0 | $0 -100.0% | $1.5M | $822.2M | $318.2M | -$1.5B |
| Other Investing Activities | $0 | $0 +100.0% | -$116.2K +91.6% | -$1.4M -91285.3% | $1.5K | $616.4M | $370.0M | $1.2B |
| Investing Cash Flow | $0 +100.0% | -$23.5K +79.8% | -$116.2K +91.8% | -$1.4M -193.9% | $1.5M | $4.8B | $6.4B | $5.1B |
| Debt Repayment | -$462.1K +36.7% | -$729.5K -43.7% | -$507.5K -68.0% | -$302.0K -851.0% | -$31.8K | $680.8M | $759.2M | $1.1B |
| Common Stock Issued | $11.4M | $0 -100.0% | $13.9M -69.8% | $45.9M +577.1% | $6.8M | $778.8M | $946.8M | $812.4M |
| Common Stock Repurchased | $0 | $0 | $0 | $0 | $0 | $351.8M | -$1.6B | $1.5B |
| Dividends Paid | $0 | $0 | $0 | $0 | $0 | $535.2M | $613.6M | $692.0M |
| Other Financing Activities | $0 | $0 | $0 -100.0% | $45.9M +577.1% | $6.8M | -$1.6B | $1.3B | $1.1B |
| Financing Cash Flow | $11.0M +1605.2% | -$729.5K -105.3% | $13.9M -69.6% | $45.6M +575.8% | $6.7M | $12.2B | $13.9B | -$15.5B |
| Effect of Forex Changes | $0 | $0 | $0 +100.0% | -$13.4M | $0 | $1.3B | $1.1B | $990.2M |
| Net Change in Cash | $4.5M +141.3% | -$10.9M -373.5% | -$2.3M -117.3% | $13.4M +313.4% | -$6.3M | $3.2B | $4.9B | $6.5B |
| Free Cash Flow | -$6.5M +36.6% | -$10.2M +39.3% | -$16.8M +47.9% | -$32.2M -121.9% | -$14.5M | $8.6B | -$16.8B | $11.1B |
Older periods hidden.
Sign in to unlockCompetitors
Peer companies in the same sector
Bear Creek Mining Corporation
BCM.V
$321.83M
Li-FT Power Ltd.
LIFT.V
$261.35M
Global Atomic Corporation
TSX:GLO.TO
$224.20M
Black Mammoth Metals Corporation
BMM.V
$182.88M
Kenorland Minerals Ltd.
KLD.V
$175.29M

Fury Gold Mines Limited
TSX:FURY.TO
$133.09M
FPX Nickel Corp.
FPX.V
$112.05M
CanAlaska Uranium Ltd.
CVV.V
$108.96M
American Lithium Corp.
LI.V
$108.40M
Power Metals Corp.
PWM.V
$91.75M
SEC Filings
Recent regulatory filings
No filings found.
Does GENM.TO generate free cash flow?
Generation Mining Limited (GENM.TO) generated -$6,469,548.00 of free cash flow in fiscal 2025.
How much operating cash flow does GENM.TO produce?
Operating cash flow was -$6,469,548.00, before capital expenditures of $0.00.
Explore More
Continue the stock analysis
Jump to another research area for this company.