
Green Brick Partners, Inc.
Consumer CyclicalNYSE:GRBK · New York Stock Exchange
-$0.85 today
Vol 0.20M · Avg 0.23M
Income Statement
Follow revenue through to earnings
Review sales, margins, expenses, and profit trends to see what is actually driving reported earnings over time.
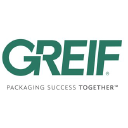
Earnings Waterfall
Revenue to Net Income
Key Ratios
Analysis
$2.0B of revenue converted into $299.1M of net income for the selected period. Gross margin is 30.8% and net margin is 14.9%, showing how much revenue survives after costs and taxes. EPS is $6.80, tying the income statement back to per-share earnings.
Income Statement
Annual data · 5 periods
| Metric | FY2025 | FY2024 | FY2023 | FY2022 | FY2021 | FY2020 | FY2019 | FY2018 |
|---|---|---|---|---|---|---|---|---|
| Revenue | $2.0B -2.8% | $2.1B +18.1% | $1.8B +1.1% | $1.8B +25.3% | $1.4B | $809.6M | $921.6M | $731.2M |
| Cost of Revenue | $1.4B +0.6% | $1.4B +13.5% | $1.2B -0.4% | $1.2B +18.6% | $1.0B | $725.6M | $804.0M | $882.4M |
| Gross Profit | $635.7M -9.6% | $703.5M +28.3% | $548.2M +4.8% | $523.0M +44.5% | $362.1M | $8.9B | $7.6B | $6.2B |
| Gross Margin | 31.2% -2.4pp | 33.5% +2.7pp | 30.8% +1.1pp | 29.8% +3.9pp | 25.8% | 9.8% | 28.9% | 38.3% |
| Research & Development | $0 | $0 | $0 | $0 | $0 | $983.2M | $1.3B | $490.4M |
| Selling, General & Admin | $226.3M -0.1% | $226.6M +17.4% | $193.0M +17.7% | $163.9M +24.6% | $131.6M | $620.6M | $923.0M | -$1.5B |
| Operating Expenses | $226.3M -0.1% | $226.6M +17.4% | $193.0M +17.7% | $163.9M +24.6% | $131.6M | $5.3B | $7.0B | $8.7B |
| Depreciation & Amortization | $5.1M +4.8% | $4.9M +37.6% | $3.5M +49.8% | $2.4M -13.7% | $2.7M | $374.2M | $1.2B | $631.8M |
| EBITDA | $443.3M -14.2% | $516.8M +30.9% | $394.9M -1.0% | $398.8M +73.0% | $230.5M | -$15.2B | $6.8B | $9.3B |
| EBITDA Margin | 21.7% -2.9pp | 24.6% +2.4pp | 22.2% -0.5pp | 22.7% +6.3pp | 16.4% | 5.6% | 46.3% | 42.0% |
| Operating Income | $409.4M -14.2% | $477.0M +34.3% | $355.2M -1.1% | $359.1M +55.8% | $230.5M | $12.3B | $14.0B | -$15.7B |
| Operating Margin | 20.1% -2.7pp | 22.7% +2.7pp | 20.0% -0.4pp | 20.4% +4.0pp | 16.4% | 16.6% | 24.1% | 22.0% |
| Interest Income | $0 | $0 | $0 | $0 | $0 | -$1.5B | -$1.6B | $405.0M |
| Interest Expense | $0 | $0 | $0 | $0 | $0 | $1.1B | $1.0B | $1.2B |
| Other Income / Expenses | $28.7M -17.7% | $34.9M -3.3% | $36.1M -3.4% | $37.4M +41.1% | $26.5M | -$1.5B | $1.4B | $1.2B |
| Income Before Tax | $438.2M -14.4% | $511.9M +30.8% | $391.3M -1.3% | $396.5M +54.3% | $257.0M | $3.3B | $4.9B | $3.6B |
| Pre-Tax Margin | 21.5% -2.9pp | 24.4% +2.4pp | 22.0% -0.5pp | 22.6% +4.2pp | 18.3% | 20.8% | 18.7% | 26.2% |
| Income Tax Expense | $94.7M -0.1% | $94.7M +11.9% | $84.6M +2.6% | $82.5M +56.8% | $52.6M | $1.3B | -$1.6B | $745.2M |
| Net Income | $313.2M -17.9% | $381.6M +34.1% | $284.6M -2.5% | $291.9M +53.5% | $190.2M | $4.9B | $4.8B | $4.7B |
| Net Margin | 15.4% -2.8pp | 18.2% +2.2pp | 16.0% -0.6pp | 16.6% +3.0pp | 13.6% | 12.4% | 17.5% | 22.5% |
| EPS (Basic) | $7 -16.7% | $9 +37.3% | $6 +2.1% | $6 +61.9% | $4 | $400.8M | $703.2M | $1.3B |
| EPS (Diluted) | $7 -16.3% | $8 +37.6% | $6 +2.0% | $6 +61.8% | $4 | $766.2M | $609.4M | $452.6M |
| Weighted Avg Shares | $43.8M -1.6% | $44.5M -2.1% | $45.4M -4.6% | $47.6M -6.0% | $50.7M | $757.8M | $925.8M | $1.1B |
| Weighted Avg Shares (Diluted) | $43.9M -2.0% | $44.8M -2.3% | $45.9M -4.3% | $48.0M -6.0% | $51.1M | $1.2B | $924.4M | $678.0M |
Older periods hidden.
Sign in to unlockCompetitors
Peer companies in the same sector
Tri Pointe Homes, Inc.
TPH
$4.00B

YETI Holdings, Inc.
NYSE:YETI
$3.82B

M/I Homes, Inc.
NYSE:MHO
$3.64B

Columbia Sportswear Company
NASDAQ:COLM
$3.43B

Visteon Corporation
NASDAQ:VC
$3.16B
Greif, Inc.
NYSE:GEF
$3.16B

The Buckle, Inc.
NYSE:BKE
$2.33B

United Parks & Resorts Inc.
NYSE:PRKS
$2.13B

Century Communities, Inc.
NYSE:CCS
$1.73B

Dream Finders Homes, Inc.
NYSE:DFH
$1.40B
SEC Filings
Recent regulatory filings
No filings found.
How much revenue does GRBK generate?
Green Brick Partners, Inc. (GRBK) reported $2.04B of revenue in fiscal 2025.
Is GRBK profitable?
Green Brick Partners, Inc. (GRBK) reported $313.23M of net income, with a net margin of 15.4%.
Explore More
Continue the stock analysis
Jump to another research area for this company.